A graphic organizer is required for a performance task lesson
Explain how air warms up by relating its change in volume due to changes in temperature, based on experimental results.
Explain how air warms up by using experimental results to highlight the connection between volume and temperature.The aim is for students to acquire this kind of logical thinking. To that end, we have set up this performance task: "As a designer, make a proposal to a carpenter for the most suitable air conditioning system for a living space".
In preparation for this task, we use the “Candy Chart” graphic organizer to summarize the basics of warming. Then we use the “Pyramid Chart” to create logical and convincing assertions based on what we know about warming. Through trial and error we reorganize the facts and our assertions about the facts to find the version of our ideas most persuasive to others.


The Benefits of Using LoiLoNote School in this Unit
First of all, you can share your own thoughts instantaneously. Furthermore, by sharing, you can further develop your own ideas based on the ideas of your friends. For example, if the situation is to "write your thoughts about XX in 4 minutes", it will be a 2-step process where first, students write out their own ideas for two minutes, and submit them to the teacher. Then, after review the ideas submitted by others as a whole class, students complete the second half by re-submitting what they wrote after incorporating the ideas of others. This system is mutually beneficial and speeds up students’ thinking process.
The advantage of using the graphic organizer on LoiLoNote is that it is simple to move and copy the cards, and it is now possible to move ideas between graphic organizers with a natural flow. For example, if you are expressing an idea based on a comparison, you can transfer cards created on a Venn diagram to the Pyramid Chart as they are, and so on.
Objectives of the Unit
It is possible to explain rationally how air warms by considering the correlation between changes in temperature and volume, on the basis of the performance task, "as a designer, make a proposal to a carpenter for the most suitable air conditioning system for a living space".
Using an understanding of the connection between volume and warming, students are able to give a convincing, evidence-based explanation to complete the performance task, “Propose the best way to air condition a living space”
Six Scenes from the Unit
1. Create rubrics with the students: “This is what I hope to achieve in this lesson.”
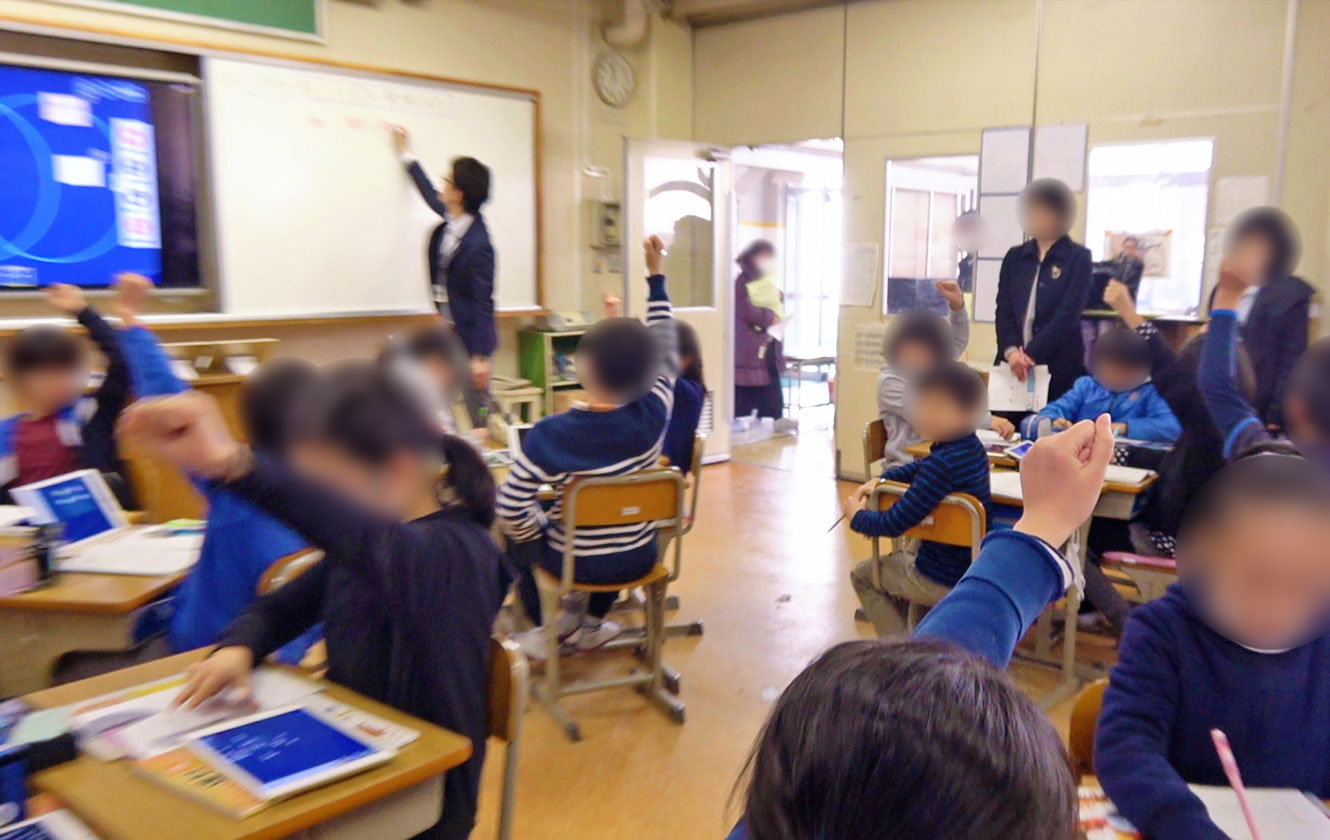
By creating our own specific objective points, we will be able to recollect what we have learned so far, and our feelings towards learning will improve further. Starting with the words, "how things warm up", we will analyze the purpose of our learning by using words learned in previous studies, such as temperature and volume. From there, the students make the rubric's A rating. There will be a group discussion for two minutes, and then we will use hand gestures to link up the comments of the students and integrate the overall opinion.
A: Able to explain how air warms by correlating changes in particles, temperature and volume.
S: Able to explain clearly how water warms up, using diagrams and graphic organizers.
 (click to enlarge image)
2. Review and examine the results of the experiment
We will review video and images of the experiment and examine rationally what happened. Looking at cards that record what we learned previously, we will think about the phenomenon of convection currents and ask ourselves if we can use what we know about how water warms or volumetric change to explain what we observed. Using a Venn diagram, we deepen our understanding by comparing "volumetric change" and "how things warms". After thinking individually, we can carry out a deeper examination by working in a group, and furthermore, we can help each other by making a general presentation of the group's observations.
 (click to enlarge image)
3. Exchange ideas as a whole and improve each other's work in order to reach a conclusion
In order to fill the gaps in ideas between the groups, we will make a general presentation. As a way to deepen the thinking of the whole class, students with supplementary opinions will give a presentation related to the initial group presentation. In this lesson, the explanation of the particle model of the volume when air warms up was supplemented by an explanation making use of the particle model in the way water warms. After the general presentation, we return to the groups for further discussion, and we will individually summarize our ideas regarding the learning task, "How will the air warm up?"
 (click to enlarge image)
4. Solving the performance task, "propose the most suitable air conditioning system to a carpenter"
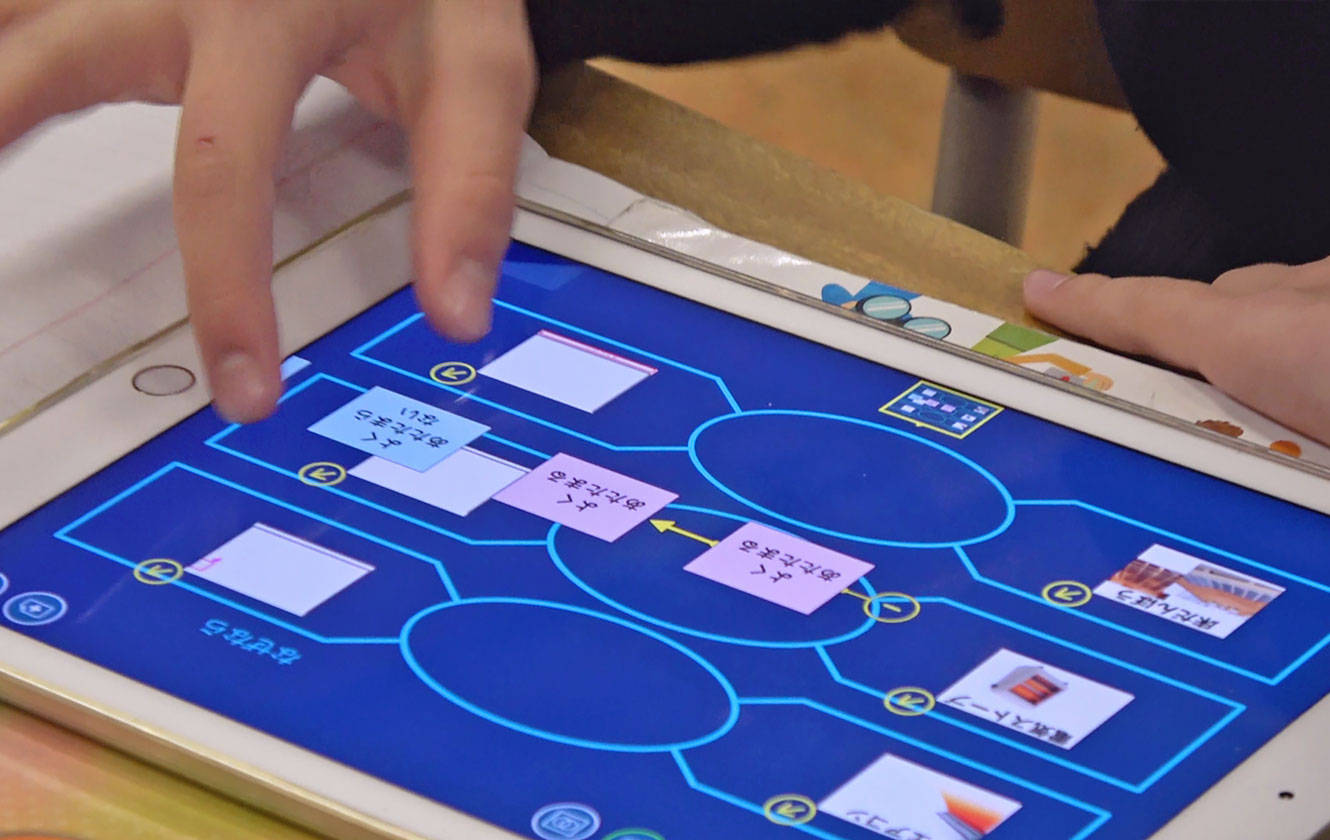
In order utilize what we have learned, we use the ideas of how air warms up to consider which of three methods – "air conditioner/under-floor heating/electric heater" – is the best for warming up the room. We clarify the conditions (air conditioning installation) and the result (if it warms up or not), and use the "Candy Chart" graphic organizer to promote thinking that focuses on that rationale. In the rationale field, the cards created in prevously (convection image diagram, experimental situation, particle model, etc) are connected. We become able to convey to the group, with clear reasons, the air conditioning installation which will warm the room up well.
 (click to enlarge image)
5. Structuring ideas to make persuasive explanations
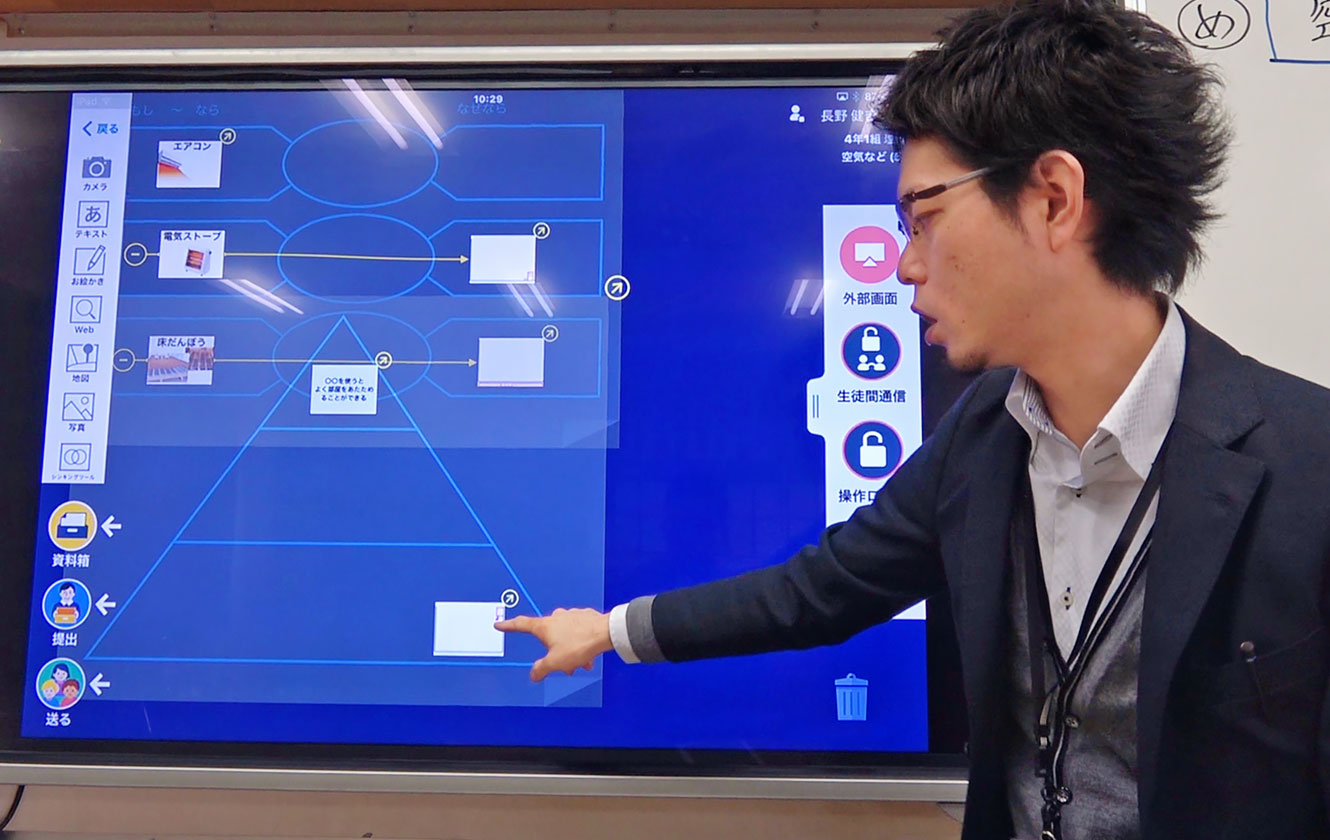
In order to persuasively explain the ideas created with the "Candy Chart" graphic organizer, we will structure them using the "Pyramid Chart" graphic organizer. In order to make the "Conditions" and "Result" parts of the Candy Chart (it warms up well if XX) into our "Assertion", we transfer those cards to the top of the Pyramid Chart. Next, we will move the "Reason" card to the "Fact" at the bottom of the Pyramid Chart. Bring the convection image to the middle stage summary, and we have completed the logical structure based on the facts.
 (click to enlarge image)
6. Work over the structure to make a persuasive explanation
In order to "make a persuasive proposal to a carpenter for the most suitable air conditioning system for a living space", if you connect the cards placed in the pyramid in the order of Top (assertion), Middle (facts) and Bottom (factual summary), you will be able to explain more persuasively. As a further device, we rebuild the order of the explanation over and over, reconnecting using deductive, inductive, abductive and other types of reasoning. First of all, we create it personally and explain it rationally within the group. By describing it orally, we noticed the structure that is easiest to communicate, and changed the order of explanation many times and presented it. The completed "Pyramid Chart" is submitted to the teacher and shared with the whole class for mutual learning.
 (click to enlarge image)